CORNA: Testing gene lists for regulation by microRNAs
Tutorial
This document is a tutorial for the CORNA package. The tutorial contains code that can be directly executed in R, the software on which CORNA is based.
- 1. Requirements
- 2. Choice of population
- 3. Reading and querying microRNA:gene pairs
- 4. Testing a transcript list for enrichment of microRNA target relationships
- 5. Testing a gene list for enrichment of microRNA target relationships
- 6. Testing a microRNA's targets for enrichment of KEGG pathways
- 7. Testing a microRNA's targets for enrichment of GO terms
- 8. Displaying quantitative data associated with a microRNA from a microarray experiment
- 9. References
1. Requirements
You will need:
- i) R, from http://www.r-project.org/
- ii) the latest version of CORNA, available from Sourceforge
- iii) the Biobase, biomaRt, GEOquery and RCurl packages, available from Bioconductor
- iv) the tools and XML packages, available from R
# To install the bioconductor packages:
source("http://www.bioconductor.org/biocLite.R")
biocLite(c("Biobase", "biomaRt", "GEOquery", "RCurl"))
# To install the other packages:
install.packages("XML")
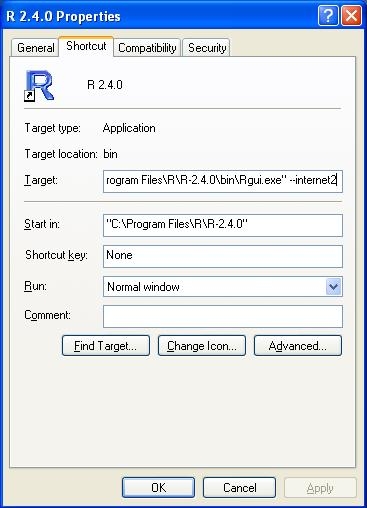
Connecting R to the internet
If you're having problems with R accessing the internet, then there are a couple of things to try.
On windows, right click the shortcut to R, and click properties. In the target box, enter the flag '--internet2':
On linux or unix systems, if you are using a proxy server, make sure
your http_proxy environment variable is set and you may also need to
execute unset no_proxy.
2. Choice of population
When performing tests that draw from the Hypergeometric distribution, defining the universe (or population) from
which the sample has been drawn is key. In the case of CORNA, we are dealing with gene lists, and so the question is:
from which population of genes have we drawn our sample gene list?
The obvious answer is "all the genes in the genome in question". However, this may not be the case - if you have not
assayed all genes in the genome, then those genes you didn't assay could never have made it into your sample, and therefore
they should not be present in the population either. For example, if you perform a microarray experiment and your microarray
only represents a subset of the genes in the genome, then only that subset should be used as the population.
The population may be further refined. For example, with CORNA, we are looking at regulation of gene lists by microRNAs, therefore
the population of genes could be further reduced to only those genes that you have assayed that also have a predicted
miRNA relationship. If you have assayed a gene that has no miRNA relationship, then that gene can never
be counted against a particular miRNA, and serves only to increase the size of the universe.
In general, the effect of a larger universe is that the resultant p-values appear more significant.
The population gene list to be used in CORNA is handled by the 'y' parameter of the corna.test.fun function. This is highly
configurable and you may input any list you wish, and there is therefore a responsibility on the user to select the correct population.
In the examples below, when testing for association of microRNAs with gene lists, the population used is all genes in
the target genome that have at least one microRNA association. When using predicted microRNA targets to test for enrichment of pathways or GO terms, only those genes with at least one pathway, or at least one GO term, are used as the population. Where a microRNA�s predicted targets are not associated with a pathway or GO term, they are not included in the analysis.
3. Reading and querying microRNA:gene pairs
Here we read microRNA:transcript target information from mirBASE and query that data set by transcript, by gene and by microRNA
# Load the data in the package:
library(CORNA)
# get full mirbase targets file
targets <- miRBase2df.fun(url="ftp://ftp.sanger.ac.uk/pub/mirbase/targets/v5/arch.v5.txt.mus_musculus.zip")
# get transcripts associated with mmu-mir-20b
corna.map.fun(targets, "mmu-mir-20b", "mir", "tran", all=TRUE)
# get microRNAs associated with ENSMUST00000056452
corna.map.fun(targets, "ENSMUST00000056452", "tran", "mir", all=TRUE)
# get transcripts associated with a list of microRNAs
vec <- sample(targets$mir, 10)
corna.map.fun(targets, vec, "mir", "tran", all=TRUE)
# get microRNAs associated with a list of transcripts
vec <- sample(targets$tran, 10)
corna.map.fun(targets, vec, "tran", "mir", all=TRUE)
# query BioMart so we now work with genes:
# obtain a link from transcript to gene from biomart
tran2gene <- BioMart2df.fun(
                biomart="ensembl",
                dataset="mmusculus_gene_ensembl",
                col.old=c("ensembl_transcript_id",
                          "ensembl_gene_id"),
                col.new=c("tran", "gene"))
# link microRNAs to genes instead of transcripts
mir2gene <- corna.map.fun(targets,
                          tran2gene,
                          "gene",
                          "mir")
# as above...
# get genes associated with mmu-mir-20b
corna.map.fun(mir2gene, "mmu-mir-20b", "mir", "gene", all=TRUE)
# get microRNAs associated with ENSMUST00000056452
corna.map.fun(mir2gene, "ENSMUSG00000046341", "gene", "mir", all=TRUE)
4. Testing a transcript list for significant miRNA associations
Here we test a list of ensembl transcripts for enrichment of microRNA-target association from mirbase. The vector tsam is loaded from the CORNA package. This vector consists of 960 randomly selected transcripts, plus 30 each for mmu-mir-155 and mmu-mir-708 - thus we expect these two to show up as significant.
# Load the package and the data in the package:
library(CORNA)
data(CORNA.DATA)
# read targets information from mirbase
targets <- miRBase2df.fun(file="arch.v5.txt.mus_musculus.zip")
# perform hypergeometric test on our tsam transcript list
res     <- corna.test.fun(x=tsam,
			  y=unique(targets$tran),
			  z=targets,
			  p.adjust="BH")
# list significant microRNAs
res[res$hypergeometric<=0.05,]
5. Testing a gene list for significant miRNA associations
Here we test a list of ensembl genes for enrichment of microRNA-target association from mirbase. The vector gsam is loaded from the CORNA package. This vector consists of 900 randomly selected genes plus 50 each for mmu-mir-155 and mmu-mir-708 - thus we expect these two to show up as significant.
# Load the data in the package:
library(CORNA)
data(CORNA.DATA)
# read targets information from mirbase
targets <- miRBase2df.fun(file="arch.v5.txt.mus_musculus.zip")
# read transcript to gene information from biomaRt
tran2gene     <- BioMart2df.fun(biomart="ensembl",
                                dataset="mmusculus_gene_ensembl",
                                col.old=c("ensembl_transcript_id",
                                          "ensembl_gene_id"),
                                col.new=c("tran", "gene"))
# convert microRNA-transcript to microRNA-gene relationship
mir2gene <- corna.map.fun(x=targets,
                          y=tran2gene,
                          m="gene",
                          n="mir")
# perform hypergeometric test on our gsam gene list
res     <- corna.test.fun(x=gsam,
                          y=unique(mir2gene$gene),
                          z=mir2gene,
                          p.adjust="BH")
# list significant microRNAs
res[res$hypergeometric<=0.05,]
6. Testing a microRNA's targets for enrichment of KEGG pathways
Here we start with the microRNA mmu-mir-155 and use the mirbase targets information to find transcripts that it targets. The microRNA-transcript relationship is converted to a microRNA-gene relationship using data from BioMart. This data is then linked to KEGG, and each pathway is tested to see if it is enriched for the genes targeted by mmu-mir-155
# load the CORNA package
library(CORNA)
# read mirbase targets data for Mus musculus
targets <- miRBase2df.fun(file="arch.v5.txt.mus_musculus.zip")
# obtain a link from transcript to gene from biomart
tran2gene <- BioMart2df.fun(
                biomart="ensembl",
                dataset="mmusculus_gene_ensembl",
                col.old=c("ensembl_transcript_id",
                          "ensembl_gene_id"),
                col.new=c("tran", "gene"))
# link microRNAs to genes instead of transcripts
mir2gene <- corna.map.fun(targets,
                          tran2gene,
                          "gene",
                          "mir")
# get those genes associated with mmu-mir-155
gvec <- corna.map.fun(mir2gene,
                      "mmu-mir-155",
                      "mir",
                      "gene")
# read pathway information from KEGG for mmu
gene2path <- KEGG2df.fun(org="mmu")
# sample is only those genes associated with mmu-mir-155 that have pathway data
gvec <- intersect(gvec, unique(gene2path$gene))
# create data frame of pathway ids and names
path2name <- unique(gene2path[c("path", "name")])
# perform the test
test <- corna.test.fun(
            gvec,
            unique(gene2path$gene),
            gene2path,
            hypergeometric=T,
            fisher=T,
            chi.square=T,
            #fisher.alternative="greater",
            min.pop=10,
            sort="fisher",
            desc=path2name)
# fetch significant pathways
test[test$hypergeometric<=0.05,]
7. Testing a microRNA's targets for enrichment of GO terms
Here we start with the microRNA mmu-mir-708 and use the mirbase targets information to find transcripts that it targets. This data is then linked to GO using BioMart and each GO Term is tested to see if it is enriched for the genes targeted by mmu-mir-708
# load the CORNA package
library(CORNA)
# read mirbase targets data for Mus musculus
targets <- miRBase2df.fun(file="arch.v5.txt.mus_musculus.zip")
# get transcripts associated with mmu-mir-708
tvec <- corna.map.fun(x=targets,
                      y="mmu-mir-708",
                      m="mir",
                      n="tran")
#Get links between transcript and GO term (molecular function) from BioMart:
tran2gomf  <- BioMart2df.fun(biomart="ensembl",
                             dataset="mmusculus_gene_ensembl",
                             col.old=c("ensembl_transcript_id", "go_molecular_function_id"),
                             col.new=c("tran", "gomf"))
#Get links between GO id and term:
go2term <- GO2df.fun(url="ftp://ftp.ncbi.nlm.nih.gov/gene/DATA/gene2go.gz")
#population here is the set of all transcripts in tran2gomf
pvec <- as.vector(unique(tran2gomf[, "tran"]))
#sample here is the set of transcripts in both my.tran.vec and population:
samvec <- intersect(tvec, pvec)
#Run CORNA test:
test <- corna.test.fun(samvec,
                       pvec,
                       tran2gomf,
                       fisher=T,
                       sort="fisher",
                       min.pop=5,
                       desc=go2term)
#significant list:
test[test$fisher <= 0.05, ]
8. Displaying quantitative data associated with a microRNA from a microarray experiment
# load the library and data
library(CORNA)
data(CORNA.DATA)
# the data used in this example comes from
# http://www.ncbi.nlm.nih.gov/geo/query/acc.cgi?acc=GSE7333
# here, three mice with mmu-mir-1-2 knocked out are compared
# to three wild type mice using the Affymetrix GeneChip Mouse Genome
# 430 2.0 Array
# Zhao Y, Ransom JF, Li A, Vedantham V, von Drehle M, Muth AN, Tsuchihashi T, McManus MT, Schwartz RJ,
# Srivastava D. Dysregulation of cardiogenesis, cardiac conduction, and cell cycle in mice lacking miRNA-1-2.
# Cell. 2007 Apr 20;129(2):303-17.
# PMID: 17397913
# this data can be read directly from GEO using a CORNA function:
# GEO.url    <- "ftp://ftp.ncbi.nih.gov/pub/geo/DATA/SOFT/by_series/GSE7333/GSE7333_family.soft.gz"
# microarray.df <- GEO2df.fun(url=GEO.url)
# however, we have packaged the data with CORNA so it is available using data(CORNA.DATA)
# we have also carried out a very simple linear model analysis to find 1273 differentially
# expressed affy probe ids.  This vector is called sam.probe.vec
# get a link from affy probe to ensembl transcript using BioMart2df.fun
tran2probe <- BioMart2df.fun(biomart="ensembl",
                             dataset="mmusculus_gene_ensembl",
                             col.old=c("ensembl_transcript_id", "affy_mouse430_2"),
                             col.new=c("tran", "probe"))
# read mirbase targets data for Mus musculus
targets <- miRBase2df.fun(file="arch.v5.txt.mus_musculus.zip")
# get transcripts associated with mmu-mir-1
tvec <- corna.map.fun(x=targets,
                      y="mmu-mir-1",
                      m="mir",
                      n="tran")
# link to significant transcripts
sigprobe <- corna.map.fun(tran2probe,
                         tvec,
                         "tran",
                         "probe", all=TRUE)
# which ones are targeted and significant?
tsig <- intersect(sigprobe$probe, sam.probe.vec)
# so the array data for these is:
my.microarray.df <- corna.sub.fun(x=microarray.df,
                                  y=tsig)
#by default, draw lines for each of them:
corna.line.fun(x=my.microarray.df,
               array.order= c("GSM176756", "GSM176758", "GSM176759", "GSM176757", "GSM176760", "GSM176761"),
               las=0, ps=11, mar=c(7,3,3,1),
               main="Significant Probes")
#Draw barplots for the first 9 probes in a 3 times 3 figure:
corna.barplot.fun(x=my.microarray.df,
                  array.order= c("GSM176756", "GSM176758", "GSM176759", "GSM176757", "GSM176760", "GSM176761"),
                  array.colour=c(rep("black", 3), rep("white", 3)),
                  row=3,
                  column=3,
                  main="Significant probes targeted by mmu-mir-1",
                  line=3)
# draw all 45
corna.barplot.fun(x=my.microarray.df,
                  array.order= c("GSM176756", "GSM176758", "GSM176759", "GSM176757", "GSM176760", "GSM176761"),
                  array.colour=c(rep("black", 3), rep("white", 3)),
                  row=7,
                  column=7,
                  main="Significant probes targeted by mmu-mir-1",
                  line=3)
This tutorial represents only part of the functionality in the CORNA package. For the rest, I recommend you read the full documentation after installing.
Comments and queries should be made to the author, Michael Watson
9. References